In the campaign statistics, you will find descriptions that range from poor to good. This article will help you learn about the different stats information you can see after a campaign is sent and its descriptions.
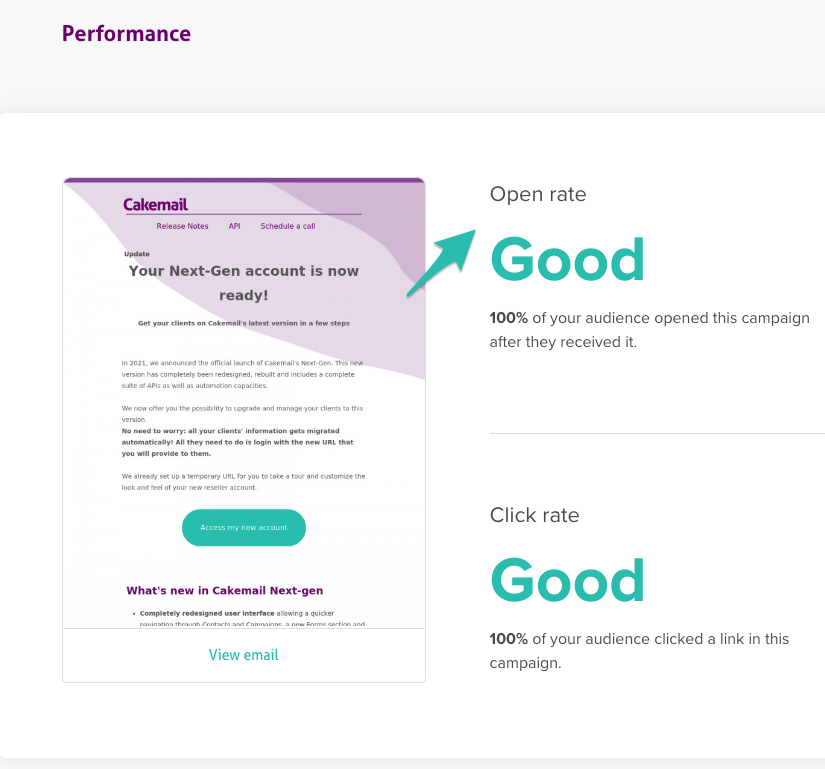
Open Rate
This statistic shows how many people have viewed your email and who has opened it. Open rates of at least 20% are considered good.
Bad = Below 10%
Average = Between 10% and 20%
Good = Between 20% and 100%
Click rate
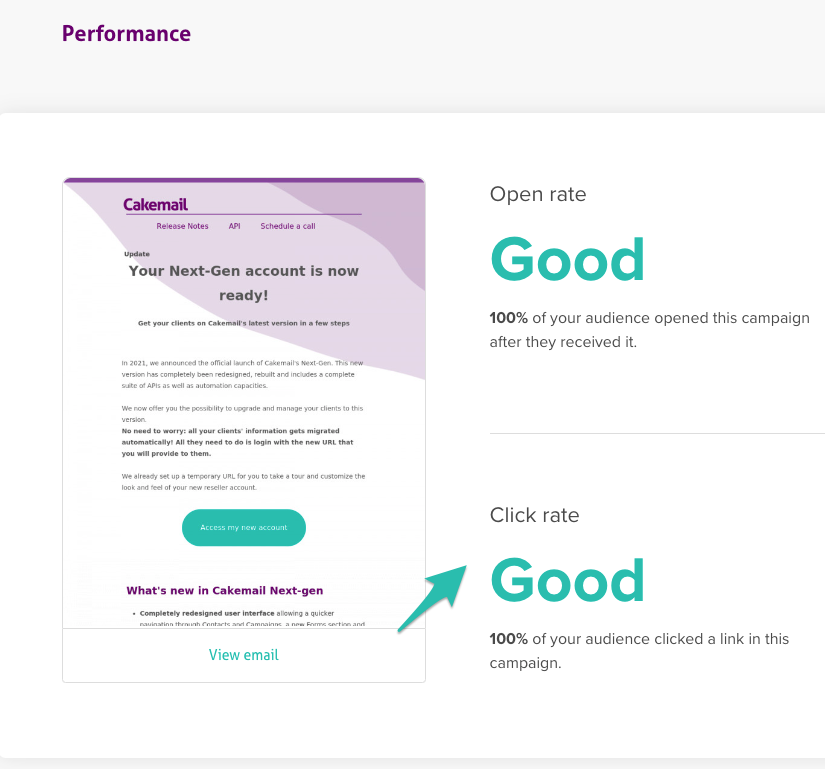
These are the percentage of people who clicked a link on your campaign.
Bad = Less than 1%
Average = Between 1% and 10%
Good = Between 10% and 100%
Unsubscribe rate
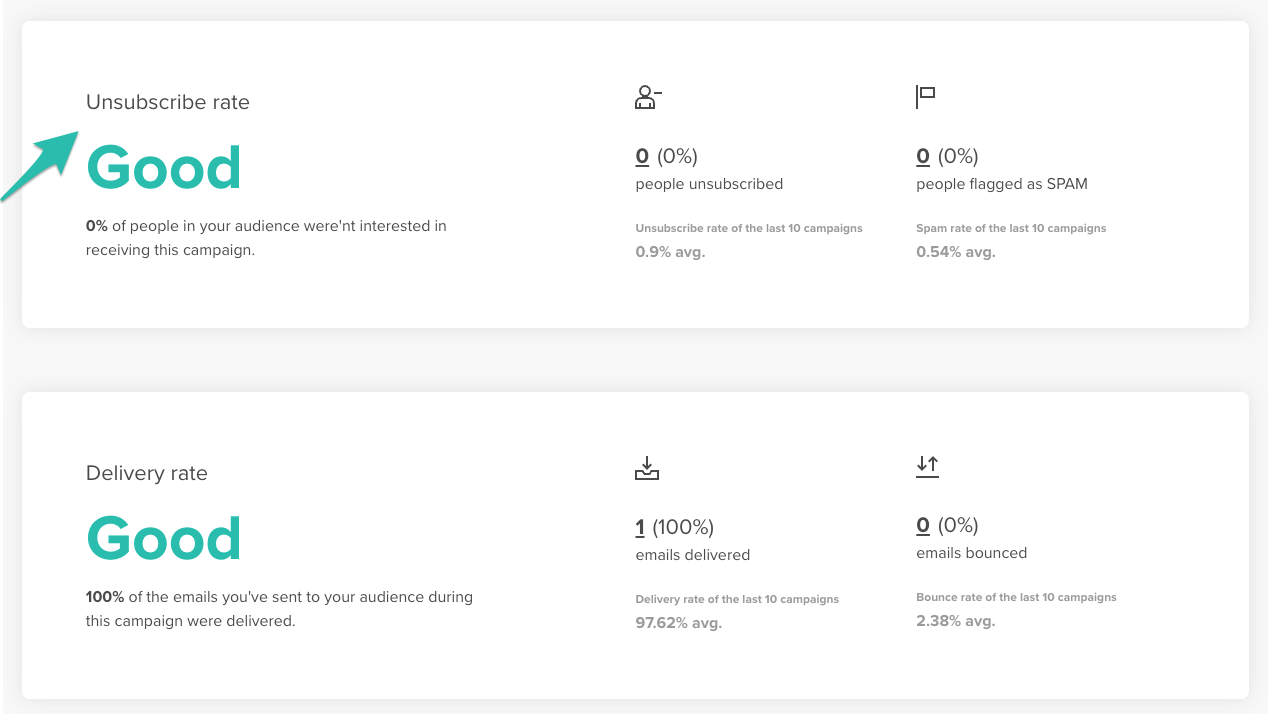
The unsubscribe rate shows how many emails have been unsubscribed and who has done so. It shows you the speed of unsubscribes in percentage.
Bad = Higher than 1%
Average = Between 0.5% and 1%
Good = Less than 0.5%
Delivery rate
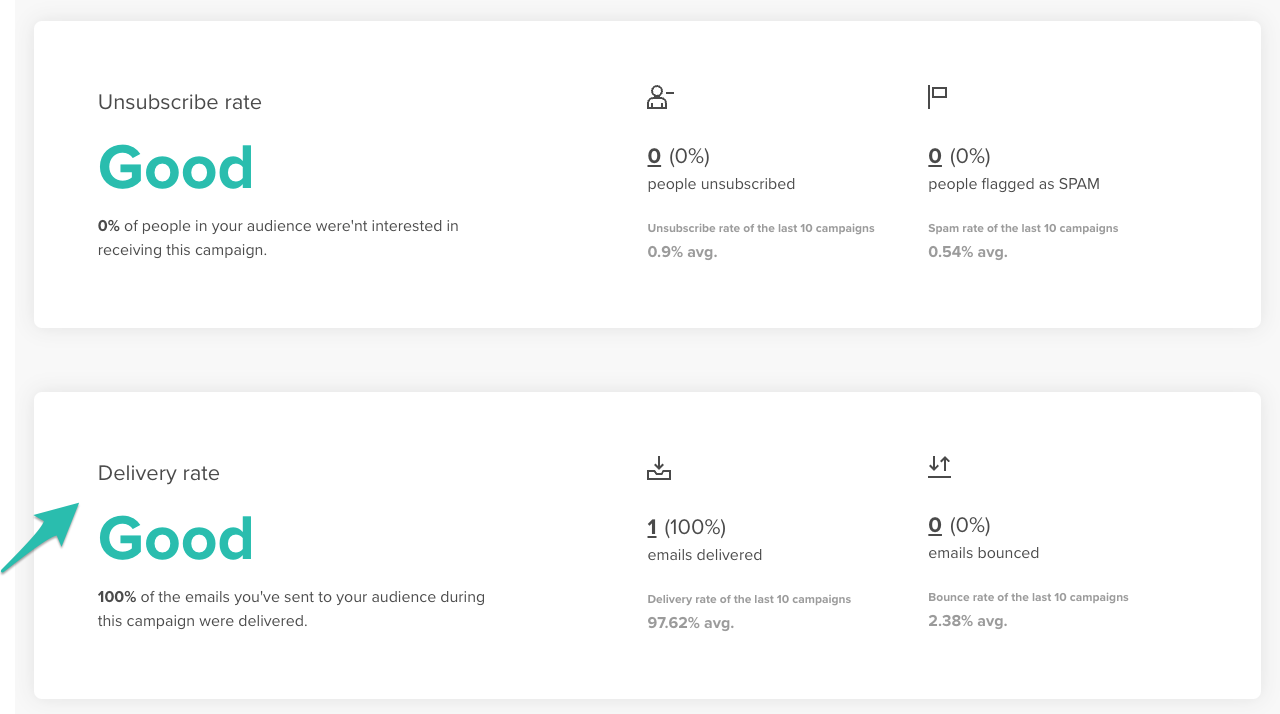
You can find out the percentage of contacts that received your campaign with this stat. You can consider this your contact list minus the bounces.
Bad = Less than 70%
Average = Between 70% and 90%
Good = Between 90% and 100%
To optimize your email marketing strategy, use this information to plan future campaigns and determine what is working and what isn't.